NEW LAUNCH: Weill Cornell Medicine's Maya app is now available for Android!

NEW LAUNCH: Weill Cornell Medicine's Maya app is now available for Android!
There are many logging tools. But options like Loggly, Sumo Logic, and others are expensive when compared with maintaining an ELK Stack, and they don’t necessarily have more or better features.
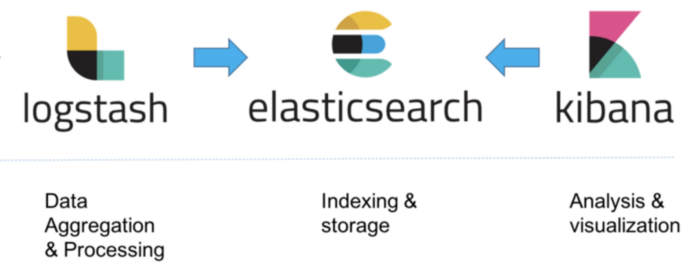
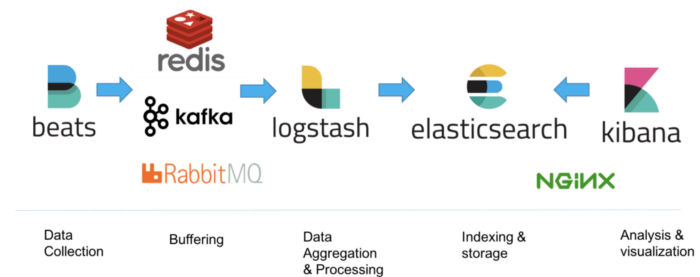
Top companies that use ELK Stack include Netflix, LinkedIn, Stack Overflow and others. This shouldn’t be surprising, if we consider all of the critical capabilities and services that that this one stack provides:
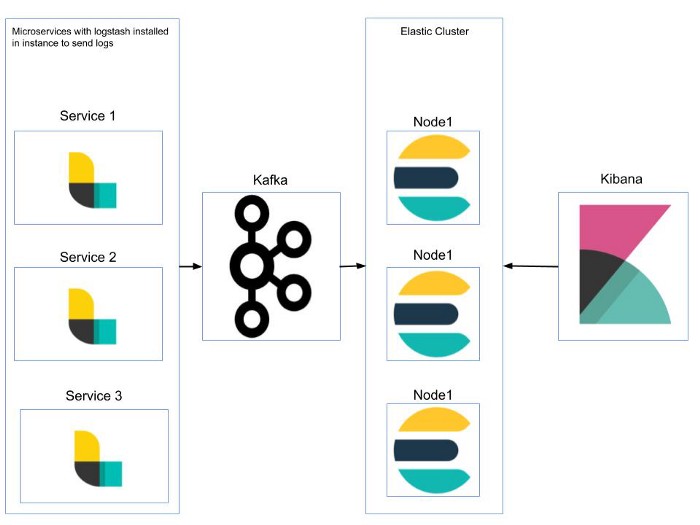
With the growth of microservices and server data, logging is increasingly important. It’s critical for diagnosing and troubleshooting issues for optimal application performance. Plus, many tools make it possible to get critical business metrics and data from logs.
Logging is no longer just for finding issues. It’s also for monitoring your systems.
If you’re ready to optimize your logging and log analysis processes, here’s what you need to do to get started with ELK Stack.
Requirements
Java 8
Homebrew 2.X.X
Installation
1. Elasticsearch
brew install elasticsearch && brew services start elasticsearch
2. Logstash
brew install logstash && brew services start logstash
3. Kibana
brew install kibana && brew services start kibana
Configure Kibana to start visualizing logs.
Open the Kibana configuration file and uncomment server.port and elasticsearch.hosts for Kibana to start listening on 5601.
sudo vi /usr/local/etc/kibana/kibana.yml
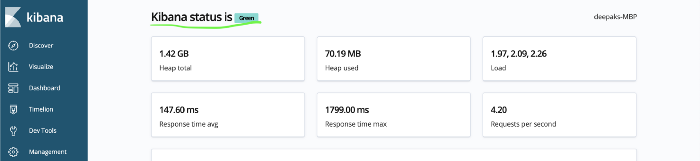
If you have successfully installed ELK Stack, you should see the Kibana status as green on http://localhost:5601/status.
Start Sending data to elasticsearch using logstash
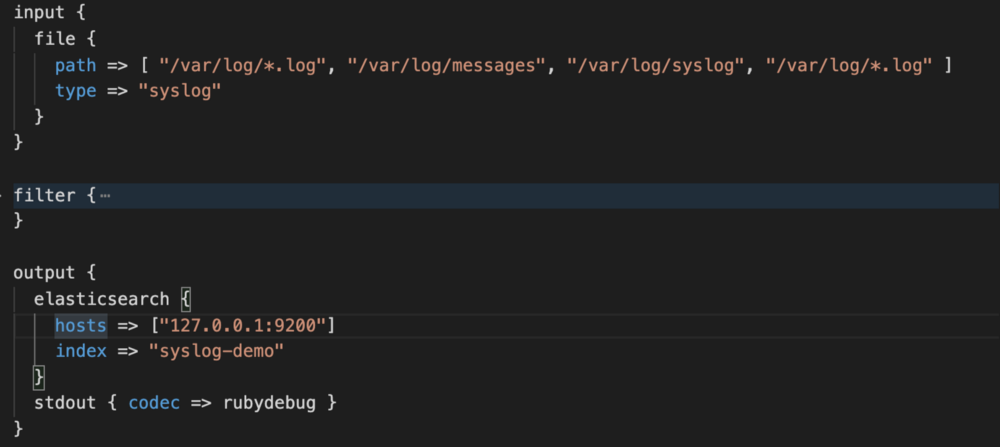
Copy this file to /usr/local/Cellar/logstash/7.6.1/libexec/config/syslog.conf.
This is the path of the configuration file for Logstash where you can configure the file path for all your log files, service logs, system logs and ngnix logs—and then transfer or send as-is to Elasticsearch.
Next, verify your configuration file.
/usr/local/Cellar/logstash/7.6.1/bin/logstash — config.test_and_exit -f /usr/local/Cellar/logstash/7.6.1/libexec/config/syslog.conf
To reflect new config file, restart Logstash.
/usr/local/Cellar/logstash/7.6.1/bin/logstash -f /usr/local/Cellar/logstash/7.6.1/libexec/config/syslog.conf
Viewing and querying logs in Kibana
On the management tab in Kibana, you’ll see the new index syslog-demo created by Logstash.
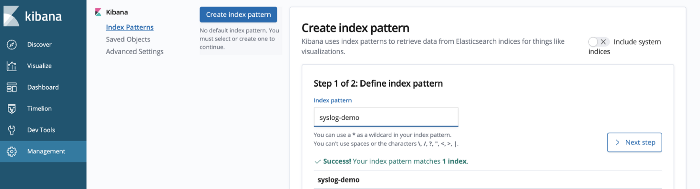
To define the index pattern to receive data from Elasticsearch, we will use the timestamp, as it can be helpful to visualize logs in chronological order.
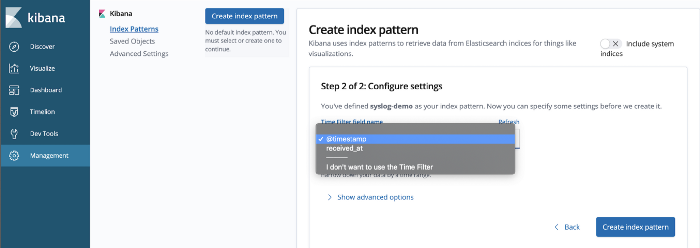
Click on Create index pattern, and you are done. You can visualize all your log files.
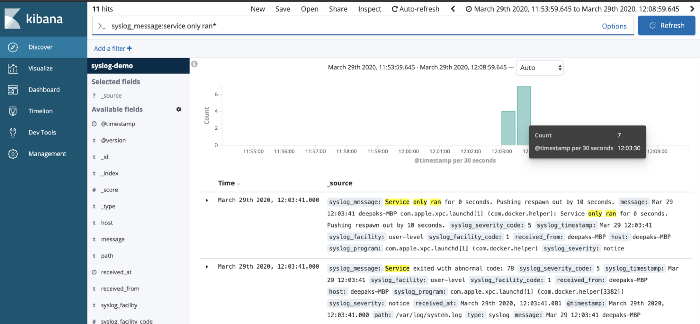
You can use text search on your logs, by adding filters or direct text-based search.
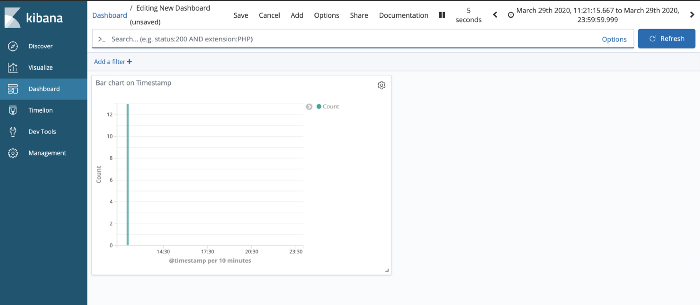
On top of these logs, you can create various visualization for monitoring critical business metrics like daily/weekly/monthly signups, registrations, subscriptions and more on your server.
You can also monitor any anomalies in your server.
Next steps
What’s next Load Testing ELK Stack with 1M Hits.
You can also read more about ELK Stack on Github.


Your phone will break before our apps do.

© 2026, Heady LLC.